


Initial deployment of 5G networks at mmWave bands showed promising indications in some aspects while experiencing coverage gaps and dead spots in some scenarios. This cannot be adequately predicted nor quantified without the aid of real field testing to tune coverage simulations to each venue’s specifics or different morphologies.
Else, this will lead eventually to either extra infrastructure cost or bad user experience vs. the 5G promise. Model calibration has been the safety net of coverage simulation and hence a standard function in any reliable indoor or outdoor planning software. However, in the mmWave case, it is becoming a more critical step to achieve reliable coverage and decent KPI’s.
Propagation studies of sub-6 GHz bands are quite mature. However, less knowledge has been obtained yet regarding mmWave propagation, particularly inside buildings. So, this article sheds light and analyzes case studies that depict the technical & business impact of skipping this step.
Mobile operators always need to deliver greater capacity while keeping minimum financial and technical risks. The cost and network complexity of indoor communications systems, particularly at mmWave bands, is strongly a function of the number of small cells or RF nodes required to achieve the coverage objectives.
Outdoor model calibration used to be a standard step for macro network planning and bypassing it causes major deficiencies in coverage. The vital benefits of such a step are well known to planning professionals. Hence, this article gives much attention to indoor networks (while extra readings are available for outdoor concerned people).
Radio propagation in an indoor environment differs greatly from outdoor, not only because of wall losses but also due to many other factors such as close proximity of reflecting structures (walls, floors …etc.), introducing different fading profiles, the density of subscribers, mobility of users, etc. And all are resulting in a totally different RF behavior that varies greatly even from one place to another within the same building.
Three basic propagation mechanisms; Reflection, Diffraction, and Scattering, influence the propagation of electromagnetic waves. During indoor network planning, RF site measurements should be conducted to examine how these mechanisms aggregate at every venue type. And this is the only method to collect the true information about the structure, examine the effect of wall materials on the signal strength, and reveal any complex propagation mechanisms. Radio design and simulation tools are essential elements during planning. However, they can’t take into calculation all the parameters of each specific environment. In several cases, the financial and technical risks could be significant if this adaptation is ignored. And this gave rise to the need for real CW measurement in order to optimize the infrastructure cost and achieve operator KPI’s as will be explained in detail in this article.
Initially, let us summarize here the reasons why the indoor environment is getting extremely complex in mmWave. And how it is impacted by various propagation mechanisms, including reflection, scattering, diffraction, and attenuation. Although these factors can be simulated using techniques such as ray-tracing, in practice, they are very sensitive to user inputs and the actual building aspects.
The higher the frequency, the higher the free space loss. Figure 1 here illustrates the path loss vs. distance for mmWave frequencies compared to sub-6GHz. For example, mmWave coverage at a distance of 200 m, experiences propagation loss around 30 dB above a low band such as 850MHz and around 18 dB compared to 3.5GHz.

Diffraction used to play a considerable role in low GHz propagation; however, its effects significantly decay at mmWave bands, as illustrated in figure 2. This means mmWave bands result in higher diffraction losses. And it’s worth mentioning, the diffraction loss would be higher if the receiver is close to the wall of buildings or any other obstructions.

Initial mmWave deployment showed surprising yet promising coverage behavior at some areas due to reflections however, this is unpredictable. Reflection in fact fosters mmWave multipath propagation as in figures 3 & 4 below; the multipath signal due to reflection from a light pole is better than the LOS signal.

At mmWave frequencies, surface roughness impacts wave propagation, causing scattering in non-specular directions that can have a great effect on received signal strength and polarization. Experimental results show that scattering at mmWave frequencies cannot be neglected as a propagation mechanism due to its significant dependence on material surface texture, grazing angle, and frequency.
Therefore, optimal designs and successful deployment of high-performance indoor 5G networks require a good understanding of scattering effects resulting from indoor surfaces and objects.
Different materials commonly used in building construction have a wide diverse of penetration losses. For example, energy-efficient or tinted glass used in modern buildings introduces additional losses that range from 24 to 40 dB compared to low GHz. Materials such as concrete or brick have similar losses that increase rapidly with frequency as per real measurement shown in figure 5. And the propagation of waves into the building will mostly be a mix of paths through different materials.

Due to the previous factor of material losses, a signal coming from the macro site will experience magnificent attenuation at mmWave frequencies compared to low GHz bands. This is explained in figure 6 which shows that the typical difference between 1.8 GHz and 3.5 GHz ranges from -10 to -15 dB, while the difference between 3.5 GHz and mmWave bands can be down to -50 dB.

These factors brought into attention that real field testing is getting an essential ingredient to tune the design to every indoor environment at the planned mmWave bands. And lack of this causes colossal business and technical impacts quantified in the next sections.
While leading vendors of indoor planning tools work hardly to make sure materials in their database are as accurate as possible, in fact, the prediction is not always accurate due to the following factors:
We summarize in this section 2 case studies explaining the effect of field measurements.
There are over 70 wall types to choose from. And Many of the wall types look similar by name, while it can be hard, especially for a non-construction RF engineer, to select the correct type. Additionally, custom walls can be defined with varying loss parameters. These custom walls might have similar names but greatly different loss figures.
The examples here address a typical case of Drywall and Sheetrock – Light. Most planning engineers consider Drywall and Sheetrock to mean roughly the same thing. The first heatmap below is for the correct value of Drywall to produce the proper passing scenario using 2* 20 W Remotes and 25 Antennas.
Instead, if the wall type is mistakenly selected to be Sheetrock Light, the coverage only requires 2* 2 Watt remotes & 12 antennas. And this will result in a fake passing heatmap, as shown in the below figure. If that flawed design is installed, later, the customer will have to either pay a higher price (more than what’s required in the proper case above) or leave a poor-performing system in place.

If we take the previous incorrect design then correct the selection of wall type from Sheet Rock – Light to be the actual Drywall, we will recognize the dramatic impact it has on performance. The figure below shows the actual failing coverage and KPI’s that will take place based on the wrong selected wall type. In other words, the price/performance impacts are extremely out of alignment.
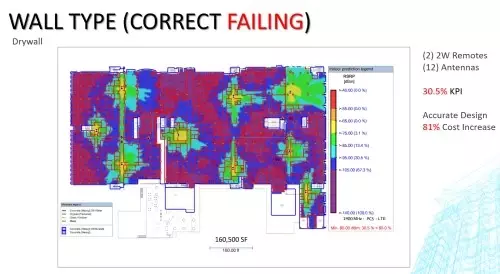
Worth mentioning, the price increase illustrated above is the baseline -in case the error is recognized before construction works- however, typically, you will realize that in a later phase. Thinking which parameters are correct for a given venue? Accurate predictions require true signal testing (called CW Testing) in various building morphologies, which can then be used to modify prediction parameters. Otherwise, this will eventually lead to a scenario where everybody is blamed!

Sampling a venue should obey some guidelines (Refer to Consultix “mmWave model calibration application note”). And we will address here two mmWave cases comparing the effect of adequate walk testing versus the case when there is no plenty of LOS samples.
In the below figure, we examine the calibrated results, which show the same as default results. No improvement was gained because we do not have Line of Sight data. We need a mix of LOS and NLOS data to improve the calibrated model, as shown in the figure afterward.
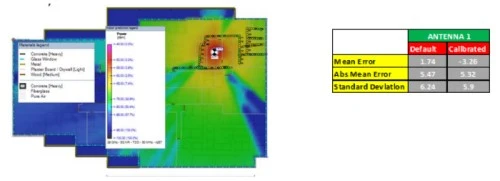
Below is the case when plenty of LOS and NLOS data were collected. We see significant improvement in calibrated data.

Post-deployment analysis of several projects showed three typical numbers sorting out coverage and KPI’s deficiencies in the case of prediction-only scenarios and the cases of CW-augmented modeling. This summarizes the financial and technical risks and implications when ignoring to fine-tune propagation models to each specific venue.


250 questions based assessment and insights
$750
65+ questions based assessment and insights
$500
160 questions based assessment and insights
$500
75+ questions based assessment and insights
Coming Soon
75+ questions based assessment and insights
Coming Soon