FWA adoption surges while speeds slow
A new analysis of U.S. fixed wireless access shows subscriber momentum outpacing performance, a signal that capacity and management strategies are under pressure.
Net adds, market share, and 5G drivers
Fixed wireless access from T-Mobile, Verizon, and AT&T added about 1.04 million net customers in Q3 2025, taking the U.S. FWA base to roughly 14.7 million. That is just over 12.5% of U.S. broadband households. The growth underscores how 5G mid-band coverage, self-install CPE, and competitive pricing are winning share against cable in many ZIP codes. The result is a real access alternative in markets where fiber is absent or slow to arrive.

Impact on cable and fiber competition
Cable’s share is challenged in lower-ARPU segments and MDUs, where quick installs and “no truck roll” are compelling. Fiber will continue to dominate peak performance and SLAs, but as FWA matures it is becoming the default interim service in pre-fiber territories. Expect churn dynamics to intensify as builds accelerate and promotional pricing cycles reset.
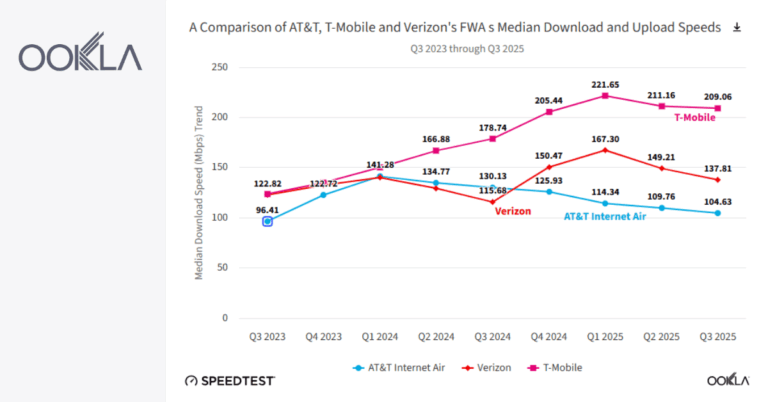
FWA performance: provider speeds and trends
Data from Ookla’s Speedtest Intelligence shows a clear speed hierarchy and a consistent mid-year dip across providers.
T-Mobile leads FWA speeds
T-Mobile remains the U.S. FWA speed leader, posting a median download around 209 Mbps in Q3 2025. That is roughly double AT&T’s median of about 105 Mbps over the same period, with Verizon in between. T-Mobile also led in median upload earlier in the year. The operator’s deep 2.5 GHz holdings and broad FWA footprint continue to translate to a performance edge.
Seasonal effects vs. capacity constraints
All three providers saw declines in both download and upload in Q2 and Q3 2025. A similar pattern showed up in 2024 for upload across all three and for download at AT&T and Verizon. Part of the drop looks seasonal: foliage attenuation in spring and summer degrades signals, especially at higher frequencies and in tree-lined suburbs. But adoption is also a factor. FWA rides the same licensed spectrum as mobile, so as household traffic grows, mid-band capacity and backhaul headroom are tested. Where traffic management and gating are loose, mobile and FWA users can both feel it.
Uploads and latency limit FWA
Median uploads dipped below 20 Mbps across providers, creating a hurdle for the FCC’s 100/20 benchmark. Latency trends matter too. AT&T’s Internet Air showed higher median latency (around 67 ms in Q3) than Verizon and T-Mobile, but it is improving quarter by quarter. For real-time apps—gaming, UCaaS, and interactive video—uplink stability and jitter will define the user experience more than raw downlink.
FWA user experience by percentile and peak hours
The tails of the performance curve and hour-by-hour behavior reveal how congestion control shapes outcomes.
High-end gains; Verizon capped at 300/20
At the 90th percentile, AT&T and T-Mobile users saw download gains year over year, indicating that with favorable RF conditions and lighter cells, the platforms can deliver very high bursts. Verizon’s 90th percentile remains constrained by published 300/20 Mbps caps on FWA, which appear to be enforced. That cap narrows the variance and supports a steadier experience for those users.
Evening congestion impacts lower tiers
At the 10th percentile, AT&T and T-Mobile customers experience noticeable evening slowdowns, with the worst performance around 8–9 p.m. This aligns with congestion-based deprioritization in their terms and typical household traffic peaks. Verizon’s 10th percentile is more stable, likely reflecting its rate shaping. For planners, this underscores the need for explicit traffic policies, not just more spectrum.
Urban vs. rural FWA performance
Urban FWA customers are more likely to meet the FCC’s 100/20 threshold than rural users due to radio geometry and site density.
Urban users more likely to meet 100/20
A larger share of urban subscribers on all three networks achieve 100/20 performance compared with rural subscribers. For example, T-Mobile’s urban users are far more likely to hit the mark than its rural base; the same pattern holds for Verizon and AT&T. The limiting factor is upload, which keeps many rural results below the bar despite healthy downlink.
Drivers of weaker rural performance
Longer distances to sites, foliage, and higher CPE mounting points combine to raise path loss and jitter. Mid-band spectrum is robust but not immune to these effects. External antennas, better CPE placement, and uplink-focused features like supplemental uplink (SUL), carrier aggregation, and UL MIMO can help, but economics and zoning remain constraints.
FWA outlook: spectrum, capacity, and consolidation
Capacity relief is on the way, but timelines vary by deal close, equipment readiness, and auction cadence.
New spectrum to ease capacity pressure
AT&T agreed to buy a 20 MHz block of 600 MHz and 30 MHz of 3.45 GHz licenses from EchoStar covering hundreds of markets, targeting a mid-2026 close. It has already equipped tens of thousands of sites for 3.45 GHz, signaling near-term gains once licenses are cleared. AT&T also won FCC approval to acquire additional 3.45 GHz and 700 MHz licenses from UScellular. Meanwhile, an FCC auction of upper C-band is expected in 2027; analysts suggest that could enable several million more FWA lines beyond current 2028 targets (12 million for T-Mobile; 8–9 million for Verizon). Net adds may slow modestly in 2026 as fiber expands and the addressable pool saturates, but new spectrum could re-accelerate growth thereafter.
Verizon scales mmWave FWA for MDUs
Verizon plans to acquire Starry’s assets and integrate its mmWave platform with Verizon’s own mmWave spectrum and fiber backhaul. The goal is to scale FWA in MDUs, where building-centric installs and short-range mmWave links can deliver high throughput without overtaxing mid-band capacity. Expect tighter building partnerships, neutral host mechanics, and rooftop-to-unit designs.
Recommendations for FWA operators and buyers
Planning for capacity, transparency, and use-case fit will separate winners from also-rans in 2026–2028.
Operator playbook for capacity and QoE
Gate FWA activations by cell load and backhaul headroom; automate congestion triggers. Accelerate mid-band overlays (3.45 GHz, C-band) and uplink enhancements such as SUL, UL CA, and 5G-Advanced schedulers. Use transparent rate shaping to stabilize the 10th percentile. Preempt seasonal slowdowns with CPE guidance, external antenna options, and RF audits in leafy suburbs. Segment offers: best-effort FWA for video-first homes, higher-priced tiers with tighter caps for work-from-home and gaming.
MDU and enterprise FWA best practices
In MDUs and campuses, consider mmWave FWA with dedicated backhaul as primary or rapid-turnup access, with fiber as the upgrade path. Validate peak-hour behavior before locking in contracts; monitor upload stability and latency. Use pro install, exterior CPE, and clear line-of-sight where possible. For branch continuity, pair FWA with SD-WAN and policy-based failover to mask evening congestion. Review providers’ network management disclosures and ask for performance envelopes by time of day.